DV Flow VSCode Extension
DV Flow provides an extension for the VSCode development environment to assist in developing and using DV Flow descriptions. The extension provides rich language support, visual task graph exploration, real-time execution monitoring, and integrated debugging capabilities for DV Flow workflows.
Installation
The extension can be installed from the VSCode Marketplace.
Requirements
The DV Flow extension requires the DV Flow Manager Python package to be installed in a Python environment accessible to VSCode.
Configuration
DFM Executable Path
The DV Flow extension searches for the DV Flow Manager (dfm) executable as follows:
Checks the
dvflow.dfmPathsetting in VSCode settingsChecks the
python.defaultInterpreterPathsetting in the workspace settingsChecks for the existence of an IVPM packages directory
Checks the PATH for the
python3executable
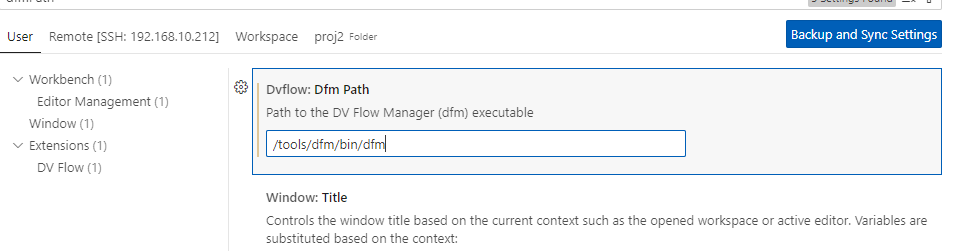
You can configure the dfmPath setting in VSCode settings. The path should point to
the dfm executable or a Python interpreter with the DV Flow Manager package installed.
Workspace Discovery
The extension automatically discovers flow files in your workspace using configurable patterns:
- dvflow.discovery.include (default:
**/flow.dv,**/flow.yaml,**/flow.yml) Glob patterns to include when discovering flow files
- dvflow.discovery.exclude (default:
**/node_modules/**,**/build/**,**/rundir/**,**/.git/**) Glob patterns to exclude when discovering flow files
- dvflow.discovery.roots (default: empty)
Explicit glob patterns for standalone root packages. If empty, roots are auto-detected
- dvflow.discovery.importedOnly (default: empty)
Glob patterns for packages that should only be shown as imports, not as roots
Execution Settings
- dvflow.execution.rundirBase (default:
rundir) Base directory for run directories, relative to workspace root
- dvflow.execution.isolateRoots (default:
true) Create separate rundirs for each root package
UI Settings
- dvflow.ui.showRootInStatusBar (default:
true) Show the active root package in the status bar
Debug Settings
- dvflow.debug.logDfmDiscovery (default:
false) Log dfm executable discovery process to the output channel
Perfetto Trace Viewer Settings
- dvflow.perfetto.url (default:
https://ui.perfetto.dev) URL for the Perfetto UI. Use this to point to a self-hosted Perfetto instance for offline use.
- dvflow.perfetto.useLocalBundle (default:
false) Use bundled Perfetto UI files instead of the online version
Features
Multi-Root Workspace Explorer
The DV Flow extension provides a comprehensive workspace explorer that displays all flow packages in your workspace, organized by standalone roots and imported packages.
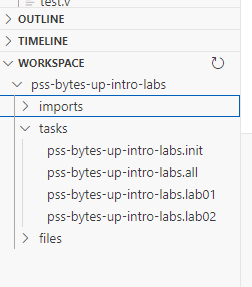
The workspace view shows:
Flow Roots - Standalone packages that can be executed directly
Imported Packages - Packages imported by root packages
Active Root - The currently selected root for task execution (marked with ← ACTIVE)
Each package node expands to show:
Parameters - Package-level parameters with their types and default values
Imports - Both local and plugin imports with navigation support
Tasks - All tasks organized by type (FileSet, Exec, Message, etc.)
Types - Custom type definitions
Files - Source files in the package
Root Selection
Multiple flow roots can coexist in a workspace. To switch the active root:
Click the package icon in the status bar, or
Use the DV Flow: Select Active Root command (
Ctrl+Shift+R/Cmd+Shift+R), orRight-click a root in the workspace view and select Set as Active Root
The active root is used for all task execution and debugging operations.
Discovery and Refresh
Click the refresh icon (🔄) in the workspace view title to refresh the package tree
Click the search icon (🔍) to re-discover flow roots in the workspace
The workspace view automatically updates when flow files are modified
Task Graph Visualization
Interactive Graph View
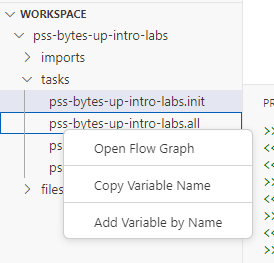
A graphical representation of a task’s execution graph can be opened from multiple locations:
Right-click a task in the workspace view and select Open Flow Graph
Click the graph icon next to a task in the workspace view
Use the CodeLens “Open Graph” link above task declarations in flow files
Right-click in a flow.dv editor and select Open Task Graph View
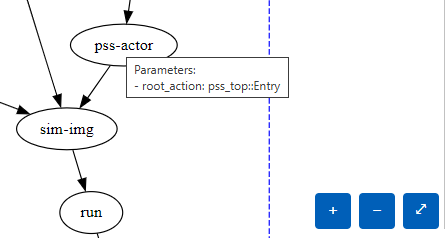
The graph view displays:
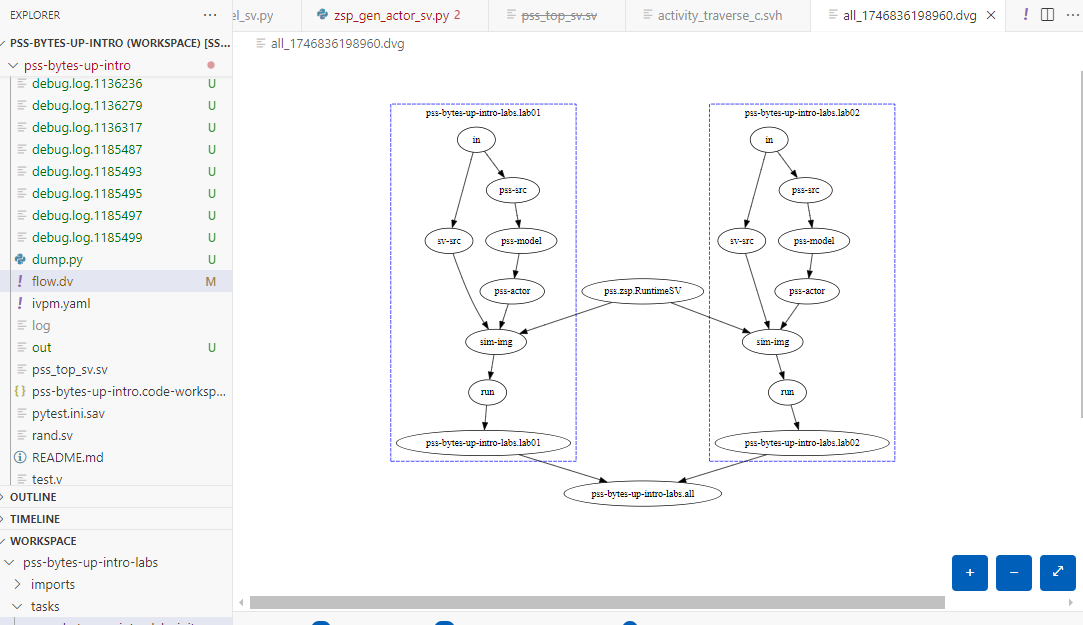
Task nodes with color-coding by type
Dependency edges showing task execution order
Hover tooltips showing parameter values and task details
Graph Features
Zoom and Pan - Use mouse wheel to zoom, drag to pan
Node Inspection - Hover over nodes to see task parameters
Edge Labels - Hover over edges to see dependency relationships
Auto-Layout - Graph automatically arranges nodes for optimal visibility
Language Support
The extension provides comprehensive language support for flow.dv and flow.yaml files.
Syntax Highlighting
YAML syntax highlighting with flow-specific token types
Semantic highlighting for task names, parameters, and expressions
IntelliSense and Code Completion
The completion provider offers context-aware suggestions for:
Task Types - Built-in task types (
std.Exec,std.FileSet,std.Message, etc.)Task Parameters - Parameter names based on the task’s
uses:typeTask References - Available tasks when completing
needs:dependenciesExpression Variables - Variables in
${{ }}expressionsImport Names - Package names when completing import references
Trigger completion with Ctrl+Space while editing flow files.
Hover Information
Hover over symbols to see:
Task Definitions - Task type, description, and parameters
Task Types - Built-in task documentation
Parameters - Parameter types and default values
Task References - Quick preview of referenced tasks
Imports - Import paths and package information
Go to Definition
Navigate to definitions with F12 or Ctrl+Click:
Task names → task declaration
Task types → type definition (if available)
Import names → imported package file
Fragment paths → fragment file
Parameter references → parameter declaration
Find All References
Find all references to a symbol with Shift+F12:
Task references in
needs:dependenciesParameter usage in expressions
Import usage across files
Rename Refactoring
Rename tasks and parameters with F2:
Renames all references across the file
Updates task names in
needs:dependenciesSafe refactoring with validation
CodeLens
Inline commands appear above task declarations:
Open Graph - Opens the task dependency graph
Diagnostics
Real-time error and warning reporting for:
Duplicate task names
Undefined task references in dependencies
Missing fragment files
Invalid expression syntax
Task Execution
Run Panel
The Run Panel provides a dedicated interface for task execution with real-time monitoring:
Open via the DV Flow activity bar icon (circuit board icon)
View execution progress with task status indicators
Stream command output in real-time
Cancel running tasks
View execution duration and statistics
Access generated Perfetto traces after execution
Run Tasks
Execute tasks using multiple methods:
From Workspace View: Right-click a task and select Run Task
From Command Palette: Use DV Flow: Run Task (
Ctrl+Shift+T/Cmd+Shift+T)From Run Panel: Select task and click Run
From Task Details Panel: Click the Run button
Task Details Panel
The Task Details panel shows comprehensive information about selected tasks:
Source location with click-to-navigate
Task type and description
Dependencies (needs)
Dependents (tasks that need this task)
Quick actions (Run, Debug, Open Graph, Open Rundir)
Select a task in the workspace view to populate the Task Details panel.
VS Code Tasks Integration
DV Flow tasks are integrated with VS Code’s task system:
Tasks can be discovered and executed through the VS Code Tasks panel
Tasks can be bound to keyboard shortcuts
Integrate with VS Code’s task execution framework
Debugging Support
Debug Configuration
The extension provides a DV Flow debugger that allows stepping through task execution:
Add a launch configuration in
.vscode/launch.json:{ "type": "dvflow", "request": "launch", "name": "Debug DV Flow Task", "task": "${command:dvflow.pickTask}" }
Press
F5or click the debug icon to start debuggingSelect the task to debug from the picker
The ${command:dvflow.pickTask} variable provides a task picker when debugging starts.
Debug Features
The DV Flow debugger integrates with VS Code’s debugging system to execute tasks:
Launch tasks through the debug interface
View task output in Debug Console
Monitor task execution status
Access standard debugging controls (run, stop)
Perfetto Trace Viewer
View Execution Traces
DV Flow can generate Perfetto traces for task execution analysis. The extension provides an integrated Perfetto trace viewer:
Auto-Detection - Run Panel automatically detects and links to generated traces
File Associations -
.perfetto-trace,.pftrace,.perfettofiles open in viewerContext Menu - Right-click trace files and select Open Trace in Perfetto Viewer
Trace Viewer Features
Full Perfetto UI embedded in VSCode
Timeline view of task execution
CPU and memory usage visualization
Task dependency critical path analysis
Export and share traces
Offline support with local Perfetto bundle
To enable offline viewing, set dvflow.perfetto.useLocalBundle to true and ensure
Perfetto UI files are available in the extension’s media directory.
Terminal Integration
Trace Link Detection
The extension automatically detects Perfetto trace file paths in terminal output and converts them to clickable links that open the trace viewer.
Terminal Output
When running tasks:
Task output streams to VSCode terminal
ANSI color codes preserved
Exit codes and error messages displayed
Working directory shown in terminal header
Editor Features
Flow File Editor
A specialized editor is provided for flow.dv, flow.yaml, and flow.yml files:
YAML syntax support with flow-specific schema
Automatic file associations
Bracket matching and auto-indentation
Comment toggling (
Ctrl+/)Format document support
File Association
The extension automatically associates:
flow.dvfilesflow.yamlfilesflow.ymlfiles
Additional file patterns can be associated with the dvflow language ID in VSCode settings.
Fragment Support
The extension supports flow fragments (reusable file includes):
Navigate to fragment definitions with Go to Definition
Hover over fragment paths to see file location
Fragment files are distinguished from package files
Keyboard Shortcuts
Default keyboard shortcuts:
Ctrl+Shift+R/Cmd+Shift+R- Select Active RootCtrl+Shift+T/Cmd+Shift+T- Run TaskF12- Go to DefinitionShift+F12- Find All ReferencesF2- Rename SymbolCtrl+Space- Trigger IntelliSense
Command Palette Commands
All commands are accessible via the Command Palette (Ctrl+Shift+P / Cmd+Shift+P):
DV Flow: Pick Task - Select a task from the active root
DV Flow: Run Task - Run a task
DV Flow: Open Flow Graph - Open task graph for a selected task
DV Flow: Open Task Graph View - Open graph from editor
DV Flow: Update DV-Flow Tree - Update workspace tree
DV Flow: Refresh - Refresh workspace explorer
DV Flow: Open Task Source - Navigate to task declaration
DV Flow: Go to Declaration - Go to import/fragment declaration
DV Flow: Select Active Root - Choose active root package
DV Flow: Set as Active Root - Set selected package as active
DV Flow: Discover Flow Roots - Re-scan workspace for flow files
DV Flow: Show Task Details - Open task details panel
DV Flow: Show Run Panel - Open run panel
DV Flow: Test DFM Discovery - Debug dfm executable discovery
DV Flow: Show Discovery Log - View dfm discovery diagnostic log
DV Flow: Open Trace in Perfetto Viewer - Open Perfetto trace file
Status Bar Integration
The extension adds information to the VSCode status bar:
Active Root Indicator - Shows currently selected root package (when
dvflow.ui.showRootInStatusBaris enabled)Click the indicator to quickly switch between roots.
Output Channel
The extension provides a dedicated output channel (DV Flow) for diagnostic information:
DFM discovery process (when
dvflow.debug.logDfmDiscoveryis enabled)Task execution output
Error messages and warnings
Extension activation logs
Access via View > Output and select “DV Flow” from the dropdown.
Workflows and Best Practices
Multi-Package Workspace Setup
For workspaces with multiple flow packages:
Organize each package in its own directory
Use the workspace explorer to visualize package relationships
Set explicit root patterns in
dvflow.discovery.rootsif neededMark utility packages as import-only using
dvflow.discovery.importedOnly
Task Development Workflow
Create or edit flow.dv file with language support
Use IntelliSense for task type and parameter suggestions
View task graph to validate dependencies
Run task from workspace view or Run Panel
View execution results and traces
Iterate based on diagnostics and output
Debugging Task Execution
Add a DV Flow debug configuration
Set breakpoints in Python task implementations
Start debugging with F5
Step through execution to diagnose issues
Inspect variables and task state
Review trace files for performance analysis
Performance Analysis
Run tasks with trace generation enabled
Open generated .perfetto-trace files from Run Panel
Analyze task execution timeline
Identify bottlenecks and parallelization opportunities
Review critical path and task dependencies
Troubleshooting
DFM Not Found
If the extension cannot find the DV Flow Manager:
Check that
dfmor Python with DV Flow Manager is installedSet
dvflow.dfmPathto the correct executable pathEnable
dvflow.debug.logDfmDiscoveryto see search processRun DV Flow: Test DFM Discovery command
Check the DV Flow output channel for errors
No Tasks Showing in Workspace View
Ensure flow.dv/flow.yaml files have valid syntax
Click the refresh button in workspace view
Run DV Flow: Discover Flow Roots command
Check that files aren’t excluded by
dvflow.discovery.excludepatternsVerify files contain
package:key (not justfragment:)
Graph View Not Loading
Check that the task has valid dependencies
Verify DFM is properly configured
Check the Developer Tools console (Help > Toggle Developer Tools)
Look for errors in the DV Flow output channel
Trace Viewer Not Working
Verify trace file is valid Perfetto format
Check
dvflow.perfetto.urlsettingIf offline, ensure
dvflow.perfetto.useLocalBundleis enabledCheck browser console in webview (see Developer Tools)
Extension Dependencies
The extension depends on:
redhat.vscode-yaml - YAML language support
This dependency is automatically installed when the DV Flow extension is installed.